
What Is TPLH (Transactions per Labor Hour)? The Key Metric for Service Productivity
You are standing in a quick-service restaurant at 12:15 on a Tuesday. The line is out the door. There are eleven people on the clock. The GM looks at the line and thinks “we need more people.” But do they? Or do they need the eleven people they already have to move faster, smarter, with fewer collisions and less wasted motion?
This is the question TPLH answers.
What Is TPLH?
TPLH stands for Transactions per Labor Hour. The math is simple: take the total number of customer transactions in a given time period and divide it by the total labor hours worked in that same period. If a location completes 240 transactions during the lunch rush using 20 labor hours, the TPLH is 12.
TPLH = Total Transactions / Total Labor Hours
The formula is not the interesting part. What is interesting is what TPLH reveals when you start slicing it up: by daypart, by day of week, by location, and over time. A single TPLH number is a snapshot. TPLH tracked with intention becomes a diagnostic tool that tells you exactly where your operation is leaking money and where it is running like a machine.
Why This Number Matters More Than You Think
Labor typically eats 25 to 35 percent of revenue in service businesses. It is the largest controllable cost most operators have. And yet most multi-unit operators manage labor with blunt instruments: weekly percentage targets, monthly P&L reviews, or the time-honored method of “the GM just kind of knows.”
Those approaches are too slow. By the time a bad labor number shows up on a monthly report, the money is already gone. You cannot un-schedule four weeks of overstaffed Tuesday mornings.
TPLH gives you a real-time pulse. It answers the most fundamental question your operation faces every single shift: do we have the right number of people for the amount of business happening right now?
The Daypart Trap
Here is where most operators get tripped up. They look at daily TPLH and think they have the picture. They do not.
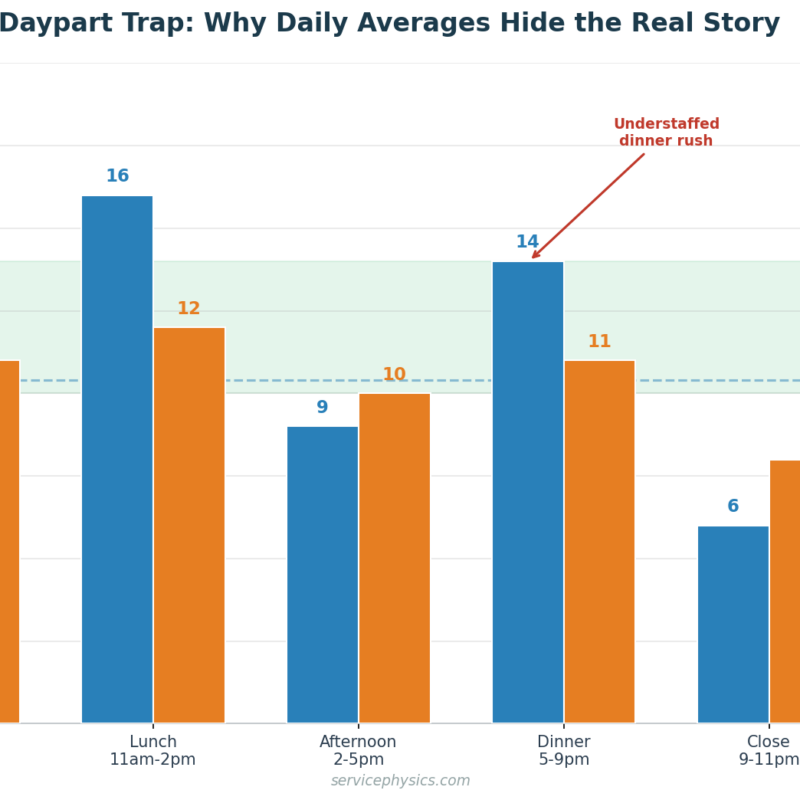
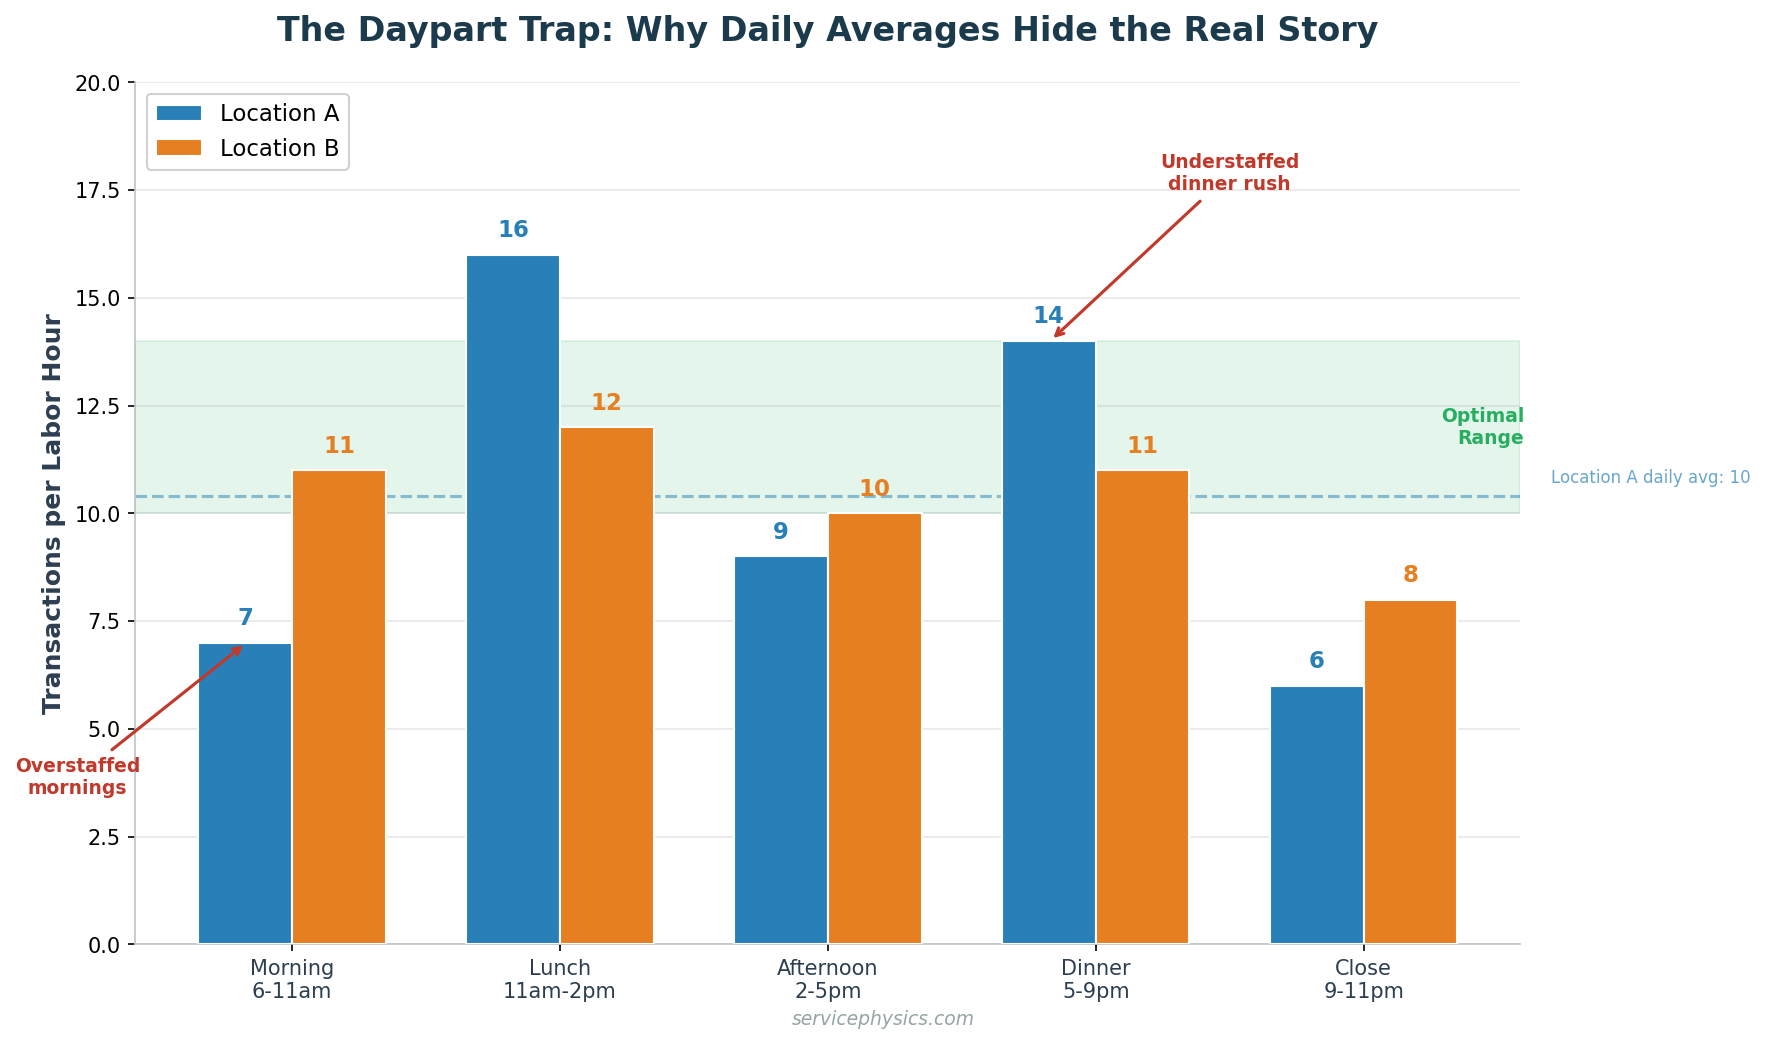
A location averaging 10 TPLH for the full day might be running 7 during the morning (too many people, not enough customers) and 14 during dinner (not enough people, customers bailing from the line). The daily average makes everything look fine. The daypart breakdown shows you a scheduling problem hiding in plain sight.
This connects directly to the discipline of effective scheduling. TPLH is the feedback loop that tells you whether your schedule matched reality. High TPLH means your team was stretched too thin. Low TPLH means you were paying for labor that was not generating revenue. The sweet spot is the range where customers are served well and labor dollars are spent wisely.
Comparing Across Locations
This is where TPLH gets really powerful for multi-unit operators. When two similar locations have significantly different TPLH during the same daypart, something is different about how they operate. One location might have a better deployment strategy. The other might have an equipment bottleneck or a training gap that nobody has surfaced yet.
We see this constantly in our work. Two restaurants in the same brand, same city, same menu, and one is running 16 TPLH at lunch while the other struggles at 11. The difference is rarely about the people. It is almost always about the process: how team members are positioned, how orders flow through the system, where handoffs break down. Time and motion studies can show you exactly where those gaps live.
TPLH vs. SPLH: Two Lenses on the Same Problem
TPLH measures volume: how many transactions per hour of labor. SPLH (Sales per Labor Hour) measures revenue: how many dollars per hour of labor. They complement each other but tell different stories.
A location can have high TPLH but low SPLH if the average check is small. Or low TPLH with high SPLH if every transaction is a big ticket. For quick-service and high-volume operations, TPLH is usually the more actionable number because it directly reflects throughput, the speed and efficiency of the service delivery system. For full-service environments, SPLH often matters more because ticket size varies so much.
The mature operators track both.
The Biggest Mistake Operators Make with TPLH
Treating it as a number to maximize instead of a number to optimize.
When you push TPLH too high by cutting labor too aggressively, service quality craters. Your team gets overwhelmed. Customers notice. Reviews drop. Return visits decline. You saved three labor hours and lost fifty customers. That is not a win.
The goal is not the highest possible TPLH. The goal is the right TPLH range for each location and each daypart that balances productivity with the customer experience you are trying to deliver.
The other common mistake is overreacting to daily swings. TPLH will bounce around because of weather, local events, seasonal shifts, and plain old randomness. Chasing every daily fluctuation creates chaos. Track rolling averages (7-day or 4-week) and investigate only when the trend breaks out of the expected range. Understanding natural variation in your data is essential here.
How We Use TPLH at Service Physics
TPLH is one of the first metrics we pull when we start working with a new client. It tells us immediately how efficiently their operation is converting labor into customer throughput. Combined with process observation and leading indicator analysis, it gives us a quantitative foundation for every recommendation we make.
During improvement projects, TPLH is how we measure whether changes in scheduling, deployment, or process design are actually producing results. It is the scoreboard.
Frequently Asked Questions
What is a good TPLH for a restaurant?
It depends on the concept. Quick-service restaurants typically target 10 to 20 TPLH depending on the daypart and menu complexity. Full-service restaurants operate much lower because each transaction requires significantly more labor time. The right benchmark is your own historical data broken down by daypart, not an industry average. What matters is the trend and the gap between your best and worst performing locations.
Should I include managers in the labor hours calculation?
It depends on what you want to measure. If you want to understand frontline labor productivity, exclude salaried managers. If you want total labor cost efficiency, include everyone. The key is consistency. Whatever you decide, apply it the same way across all locations and time periods so your comparisons are valid.
How often should TPLH be reviewed?
Daily by general managers, weekly by district or area managers, monthly at the executive level. The daily review is about real-time adjustment: did today’s staffing match today’s business? The weekly review is about scheduling optimization: are our forecasts accurate? The monthly review is about strategic trends: are we getting more or less efficient over time, and why?
Related Glossary Terms
TPLH does not exist in a vacuum. To understand why your TPLH is what it is, use Value Stream Mapping (M&IF) to visualize the flow of work and identify where time is being lost. When TPLH reveals a problem, A3 Problem Solving gives you a structured way to diagnose the root cause and test countermeasures.
TPLH is the metric most operations strategies are built around, and it is one of the few numbers a management system should review every day.

Insights in your inbox
Stay ahead of what’s next in service operations. Sign up for the Service Physics mailing list to get our exclusive insights in your inbox.